Contents · 6 sections
Part of What Is Jev? Six Hands-On Experiments With TypeSafe's System One Model. Every number here comes from a saved run you can download at the end of the post.
Every answer Jev gives comes with a probability, and TypeSafe trains the model specifically so those probabilities mean what they say. That's a claim you can only check with data that has real labels. We used the UCI SMS Spam Collection: 5,574 text messages, 747 of them spam, each labeled by a person years ago for exactly this kind of test.
Setup
state: { sms: "WINNER!! As a valued network customer you have been selected…" }
questions:
  spam: Noul   "Is this SMS spam: an unsolicited commercial, promotional or scam message
               sent in bulk, rather than a personal message between people?"
  kind: Choice ham · spam
→ 5,574 calls · 126 s · 2.13M tokens · $0.09
One sentence of instruction, no examples, no fine-tuning. We ran every message once, eight calls in flight at a time, and kept the probability for each. Then three questions: is it right, is the probability honest, and what threshold would you pick for a real filter.
Is it right?
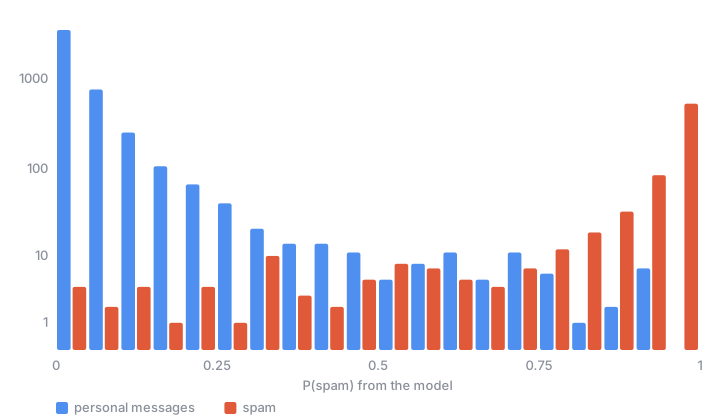
At a 0.5 threshold it caught 711 of 747 spam messages and wrongly flagged 55 of 4,827 personal ones. The Choice version of the same question gave the same AUC with slightly different precision and recall; the two primitives disagreed by 0.04 on average. For context, always predicting the base rate would score a Brier of 0.116; the model scored 0.015.
Is the probability honest?
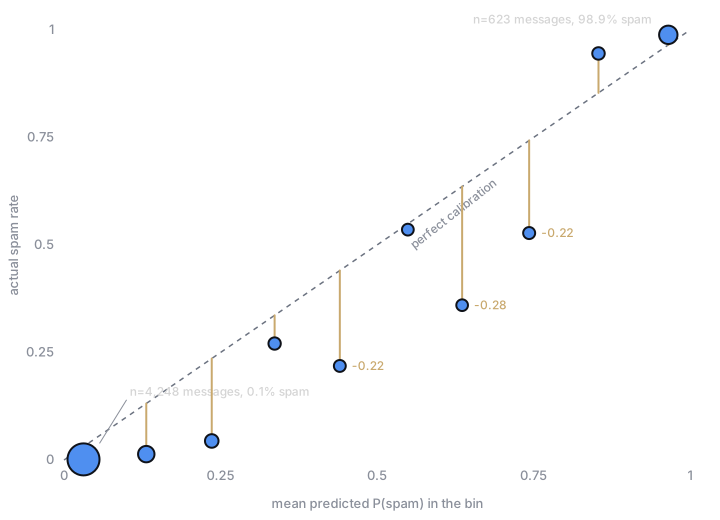
Seventy-one percent of messages got an answer below 0.05 or above 0.95, and those bins sit within three points of the diagonal: when it says "almost certainly spam" or "almost certainly not", it's right at that rate. Expected calibration error over all bins was 0.042.
The middle of the range tells a more specific story. From 0.1 to 0.8 the actual spam rate ran 7 to 28 points *below* the stated probability. When the model is unsure, it's a little more suspicious than the messages deserve. Only 140 messages (2.5%) live in that 0.3–0.7 zone, so the effect on the overall numbers is small, but a threshold placed there should account for it, and the bins are thin (25 to 55 messages each), so their gaps are themselves uncertain.
| P(spam) bin | Messages | Mean P | Actual spam rate | Gap |
|---|---|---|---|---|
| 0.0–0.1 | 4,248 | 0.031 | 0.001 | −0.030 |
| 0.1–0.2 | 366 | 0.131 | 0.014 | −0.118 |
| 0.2–0.3 | 113 | 0.236 | 0.044 | −0.192 |
| 0.4–0.5 | 32 | 0.441 | 0.219 | −0.222 |
| 0.6–0.7 | 25 | 0.636 | 0.360 | −0.276 |
| 0.8–0.9 | 55 | 0.854 | 0.945 | +0.092 |
| 0.9–1.0 | 623 | 0.965 | 0.989 | +0.023 |
Picking a threshold
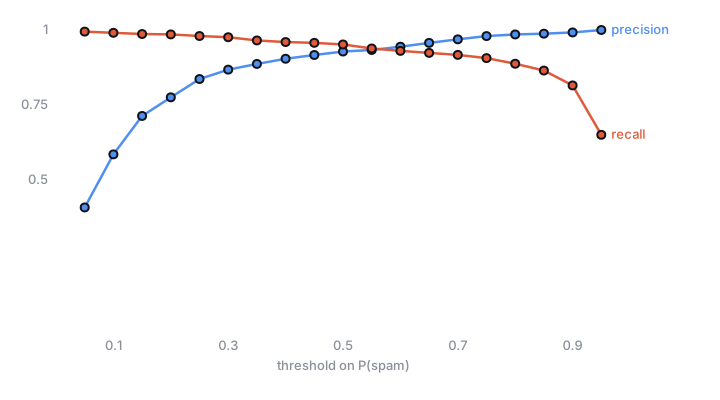
| Threshold | Precision | Recall | Personal messages misfiled | Spam missed |
|---|---|---|---|---|
| 0.3 | 0.868 | 0.976 | 111 | 18 |
| 0.5 | 0.928 | 0.952 | 55 | 36 |
| 0.7 | 0.969 | 0.917 | 22 | 62 |
| 0.9 | 0.992 | 0.815 | 5 | 138 |
About the mistakes
Eleven messages labeled spam got a probability under 0.2, and several of them are forwarded jokes that the dataset's labelers filed as spam ("How come it takes so little time for a child who is afraid of the dark to become a teenager who wants to stay out all night?"). Ten personal messages got over 0.8, and several are plainly promotional ("HCL Chennai requires FRESHERS for voice process, excellent English needed, call Ms. Suman"). The true error rate is somewhat below the measured 1.6%. We mention this because it's the kind of thing a probability lets you see: the confident disagreements are worth a look, and some of them are the label's fault.
What we'd do with this
For a yes/no judgment on short text, the probability is something you can build on: gate automatically at the extremes, route the thin middle to a person, and expect the rates you were promised. If an application needs the middle of the range to be an exact probability rather than "unsure, leaning yes", a simple re-mapping from a table like the one above does it. The whole dataset cost nine cents and two minutes, which makes re-checking calibration on your own labeled data a routine thing rather than a project.