More from daniel yanez


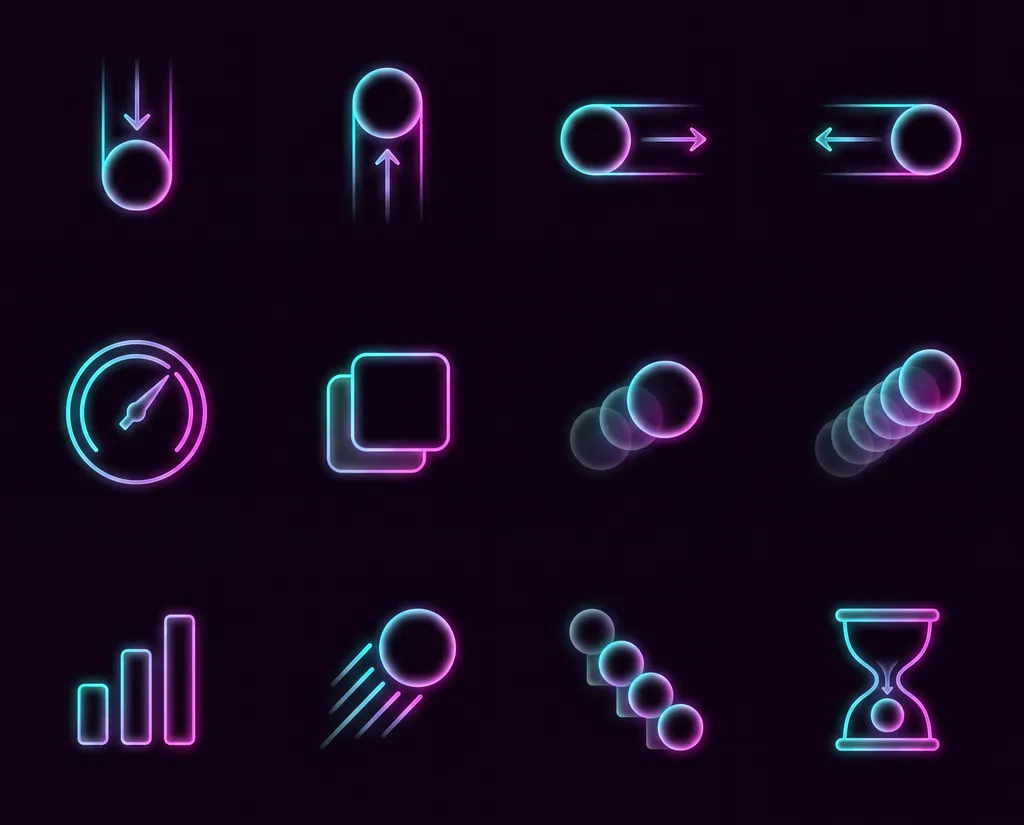
Neon motion and statistics interface icons
Image by Nano Studio Pro · daniel yanez — free under CC BY 4.0
A collection of twelve digital interface icons rendered in a vibrant neon aesthetic, featuring a smooth color gradient transition from cyan to magenta. The icons are arranged in a clean 3x4 grid against a dark, near-black background. Each icon represents a different type of animation, physical trajectory, or data metric. Elements include directional arrows indicating vertical, horizontal, and projectile motion, along with symbolic representations of speed (speedometer), data aggregation (stack), frequency (bar graph), and temporal progression (hourglass). The glowing edges, soft lens-blur effects, and semi-transparent layers suggest a modern UI design for animation software or high-end performance monitoring tools. The overall aesthetic is sleek, futuristic, and highly polished, utilizing a consistent stroke weight and rounded geometric forms.
More from daniel yanez